English
  Turkish
  Deutsch














Heatmap
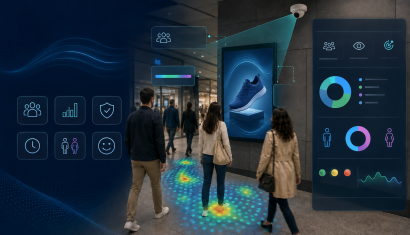
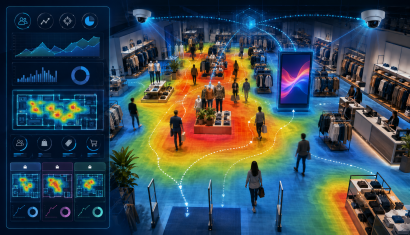
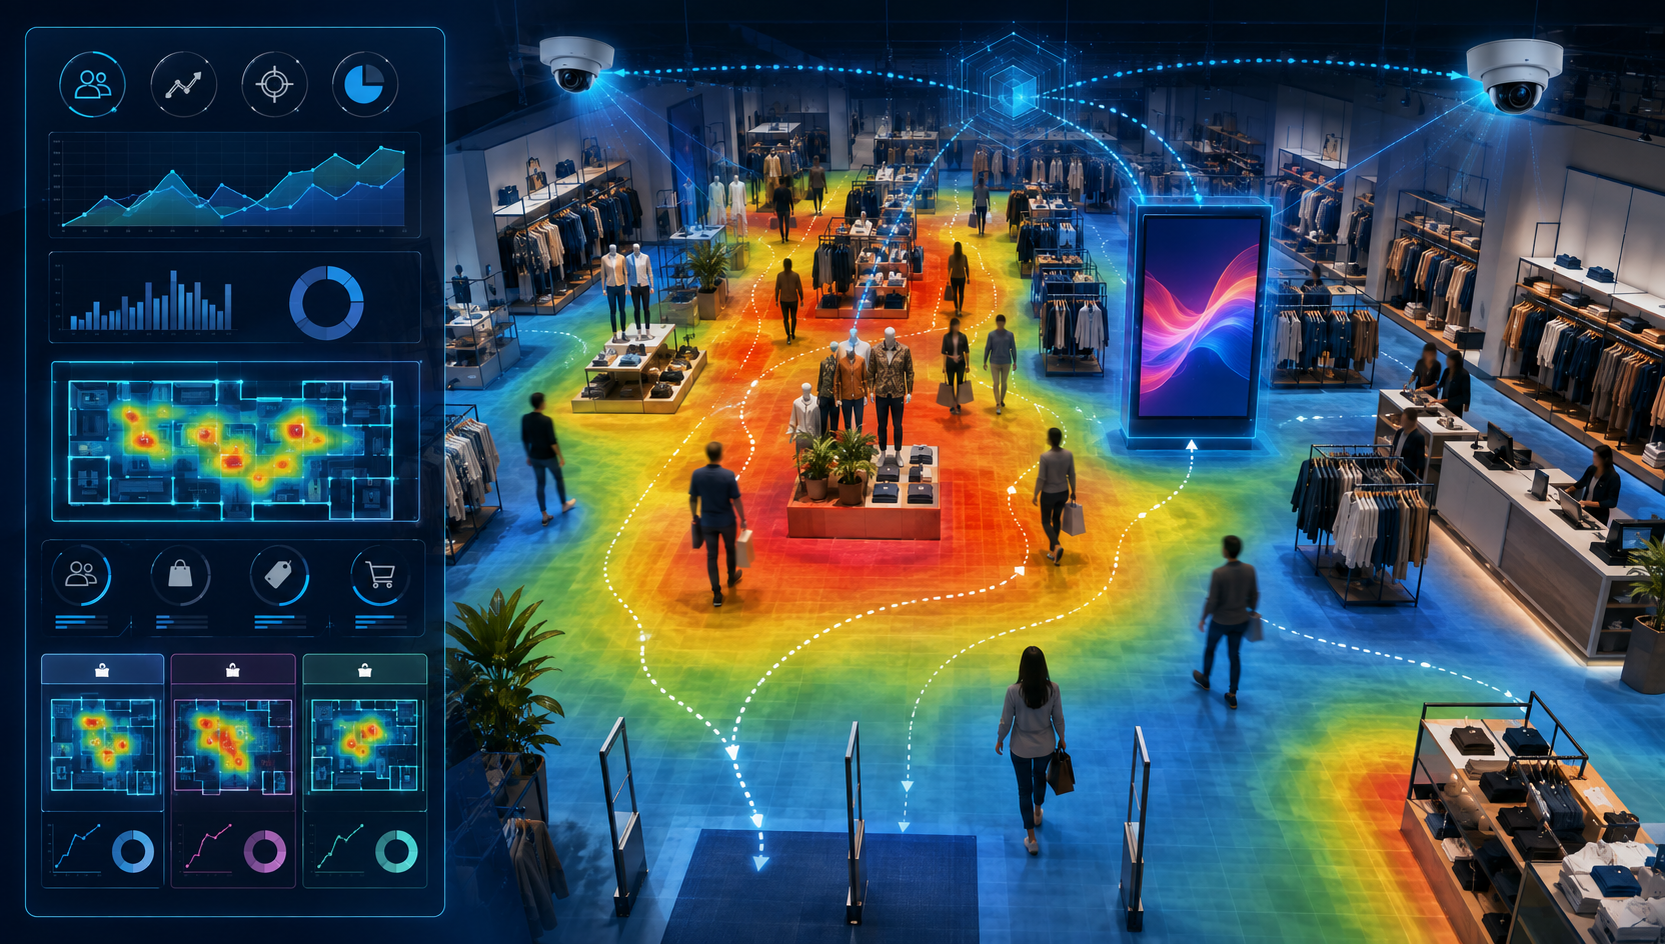
Heatmap is a measurement solution within the Unisoft ecosystem that processes movement data captured from existing in-store cameras and transforms it into a color-coded density visualization on the store layout. Red and orange tones indicate high-interest areas, while blue and green tones represent lower traffic. It reveals which departments, aisles, and zones actually attract visitors, how traffic changes over time, how long people stay in specific areas, and the movement routes they follow. Through CMS integration, this data can also be used to trigger content in real time.
- Density Maps — Color-coded visualization on the store layout makes it easy to understand at a glance which areas receive the most attention.
- Aisle & Department Analysis — Provides actionable insights at department level beyond overall store traffic data.
- Time-Based Analysis — Hourly and daily traffic changes can be used for staff planning and campaign scheduling.
- Dwell Time Measurement — Measures the quality of time spent in a specific area rather than focusing only on visit counts, providing stronger conversion signals.
- Movement Routes — Visualizes the customer journey from entrance to exit and identifies typical movement patterns.
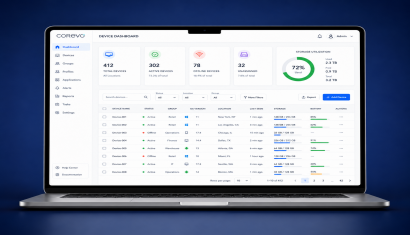
- Centralized Reporting — Enables branch-to-branch comparison through a consolidated dashboard for multi-location retail chains.
- Works with Existing Cameras — Uses movement data from existing in-store cameras without requiring additional hardware.
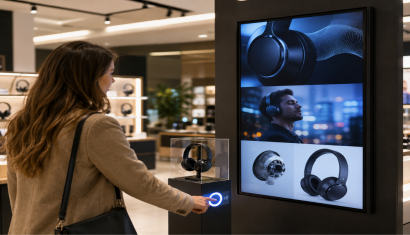
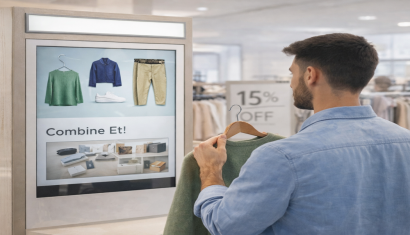
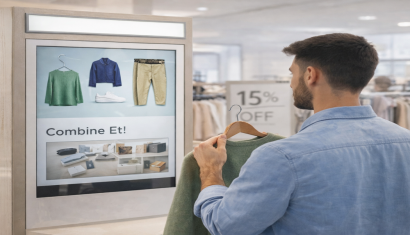
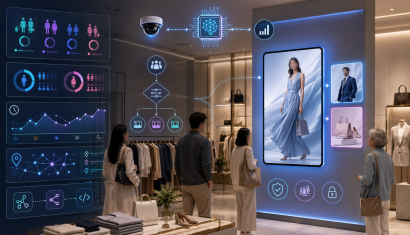
- CMS Integration & Triggering — When a defined level of traffic is detected, a rule can be triggered and the relevant content can automatically be displayed on screens.
- Industry-Specific Applications — Answers different retail questions across fashion, electronics, grocery, and other formats, such as storefront interest, demo engagement time, or checkout-area traffic.
- Data-Driven Decision Making — Department placement and campaign area selection are based on measured real-world traffic data rather than intuition.
A retail heat map is an analytics solution that uses colours to show visitor movement data on a store floor plan. It helps identify frequently visited areas and locations that attract less attention. In this context, a heat map visualizes visitor traffic rather than measuring temperature.
The solution can be used to evaluate movement data from existing store cameras. However, camera positions, image coverage, and technical compatibility should be checked before installation. Compatibility with every existing camera system should not be assumed without assessment.
Analysis can cover aisle and department traffic, time spent in specific areas, movement routes, and traffic changes over time. These data help explain interest in different parts of a store. Available analyses depend on camera coverage and system configuration.
Identifying high- and low-traffic areas provides data for department layouts and promotional placement. Hourly and daily changes can inform staffing and campaign timing. Results can be interpreted alongside sales data; high visitor traffic alone does not demonstrate increased sales.
With an appropriate configuration, data from different branches can be compared through centralized reporting. In projects with CMS integration, traffic density can trigger relevant display content according to defined rules. Reporting scope and content triggers are established during integration.
Briefly share your needs and our expert team will analyze the most suitable solution for you. We can schedule a project-specific demo, prepare a detailed quote, or review your technical questions together. We will contact you as soon as possible.